T.C
TEKİRDAĞ NAMIK KEMAL ÜVİVERSİTY
Faculty of Agriculture
Department of Agricultural Economics
AGRICULTURAL POLICIES APPLIED LIVESTOCK IN TURKEY
Abdirizak ALI ABDULLAHI’
2019
Abstract
Livestock products are an
important source of household income for many farmers and households in rural
areas. For small farmers, livestock products such as cattle, generate income
and ensure food security for these households because an important amount of
their incomes comes from the sales of animal and milk In this study, it has
been examined the relationship between developments of Turkish livestock
production for the last ten years and supports given to livestock production.
Although there is a significant potential in terms of the number of animals,
yields obtained those animals are low.
The main factor is the devaluation of the currency. The currency
fluctuation and devaluation is difficult for importers, including the Turkish
Milk and Meat Board as they are importing cattle in dollars and selling on the
local market in Turkish Lira (TL). Changing which is started in 2000 in Turkish
agriculture policies has taken back the livestock production sector. The import
of cattle reached in 2-17 113.566 heads 2.244 $ per head and reached
254.793.487 million dollars. Current findings revealed that the share of
agriculture in the total budget was quite low compared to other sectors and
such a share did not change much despite the continuous changes in agricultural
and support policies. Considering the distribution of the supports based on
types, it was observed that the increase in livestock supports and subsidiary
payments made especially to supply-deficit products were considered as positive
outcomes of implemented support policies. In the livestock sector such as
cattle production is low In order to improve it is important to develop
management and maintain support policies for the livestock sector. Livestock
sector in turkey needs to turn to the construction and improvement of permanent
end sustainable-sized enterprises.
Keywords: Livestock, milk production, meat production,
consumption, import, export, support payment, policy
Introduction
The Turkish livestock sector has
considerable potential and is an important part of the agricultural sector and
the economy. Livestock constitutes approximately 25% of the value of all
agricultural production and contributes to the economic development of rural
households. The establishment of the Republic of Turkey today, the presence of
animals showed significant changes. From the first years of the Republic to the
Second World War, there was a significant numerical increase. In the war years,
the rate of increase has fallen and even some species have decreased. In the
period following the end of the war, the numerical increase accelerated, and
the highest numerical values were reached between 1960-1980 depending on the
species. In the 1980s, the number of animals in all species began to decrease
rapidly (Akbay & Boz, 2019).
Livestock products are an important
source of household income for many farmers and households in rural areas. For
small farmers, livestock products such as cattle, generate income and ensure
food security for these households because an important amount of their incomes
comes from the sales of animals and milk (Akbay & Boz, 2019).
The livestock sector in turkey
The world cattle inventory in 2018 is at 1.002 billion head. Are shown in Table (1.0) roughly 63% of the world's cattle are in India, Brazil & China. (The cattle inventory in India includes water buffalo). Turkey is one of the ten largest cattle-producing countries due to the ranking of countries in 2018.
Table (1.0) shows World cattle inventory: Ranking of Countries
World cattle inventory: Ranking of Countries
|
Rank
|
Country
|
% Of World
|
1
|
India
|
30.44%
|
2
|
Brazil
|
23.19%
|
3
|
China
|
9.67%
|
4
|
United State
|
9.42%
|
5
|
EU
|
8.83%
|
6
|
Argentina
|
5.37%
|
7
|
Australia
|
2.55%
|
8
|
Russia
|
1.83%
|
9
|
Mexico
|
1.66%
|
10
|
Turkey
|
1.45%
|
|
USDA: 2018
The livestock sector in Turkey, which plays an important role in adequate and balanced nutrition of people; to increase national income and employment, to provide raw materials for meat, milk, textile, leather, cosmetic and pharmaceutical industries, to contribute to the development and to increase foreign exchange revenues through export.
Livestock is essential for both human nutrition and agricultural industries. Hence, governments often apply some support policies in order to develop profitable livestock husbandry and a better life. Although the governments applied some statist support policies until 1980, some public support policies have started to be applied after this year. In the following table (2.0) and graph (1.0) we will see protein production and consumption for an animal in some countries respectively (NEWS, 2018) (Ertürk & Orhan, Livestock Support Policies In Turkey Since 2000, 2015).
Table (2.0) shows protein production in some countries
Country
|
Herbal Protein
(G / person / day)
|
Animal Protein
(G / person / day)
|
Total Protein
(G / person / day)
|
Animal Protein
Rate (%)
|
EU Countries
|
43
|
60
|
104
|
58
|
African countries
|
53
|
16
|
69
|
23
|
Turkey
|
72
|
36
|
108
|
34
|
Source: FAO
Graph 1.0 shows Protein Consumption Per Capita
Large animals in turkey (cattle)
According to FAO data, there were 1,426,064,857 cattle in the world by 2013. The three biggest producers in the world were Brazil (211.8 million), India (189 million), and China (113.6 million). In terms of cattle presence France, Germany, and England were the leading countries in the EU. Turkey was the 7th in the world and 2nd in the EU for cattle existence (FAO, 2016). The number of cattle in Turkey was around 14.4 million, 42.6% was cross-bred, 43.4% was culture race and 14.0% was a native race (TURKSTAT, 2016). The cattle number estimate for 2019 is expected to be 15.8 million head which is only four percent higher than 2018 due to several factors. The main factor is the devaluation of the currency. The currency fluctuation and devaluation is difficult for importers, including the Turkish Milk and Meat Board (an affiliated body to the Turkish Ministry of Agriculture and Forestry), as they are importing cattle in dollars and selling on the local market in Turkish Lira (TL). As shown in graph (2.0) the production of cattle in turkey between 1960-1980 increased while 1990-2010 decreased because of some droughts and challenges faced by livestock production. In 2017 reached 15.944 million heads of cattle are produced. Nowadays, livestock sector; feed industry, meat, and products industry, milk, and products industry, leather and textile industries, veterinary drugs and livestock equipment industries, etc. components create new employment areas and create added value by processing animal products (Ertürk & Orhan, 2015).
Turkey's 1991 total of 11 million 973 thousand which is 11% of culture breeds of cattle, 34% hybrid race, while the 55% are indigenous breeds 49% of the culture breeds of a total of 16 million head of cattle in 2017 41% are cross-breed and 10% are indigenous. There are some differences according to the years.
Table 3.0 shows annual turkey assets from (1991 to 2017)
Years
|
Cattle Culture
|
Cattle-culture hybrid
|
Cattle-Indigenous
|
Total
|
1991
|
1.253.865
|
4.033.375
|
6.685.683
|
11.972.923
|
1995
|
1.702.000
|
4.776.000
|
5.311.000
|
11.789.000
|
2000
|
1.806.000
|
4.738.000
|
4.217.000
|
10.761.000
|
2005
|
2.354.957
|
4.537.998
|
3.633.485
|
10.526.440
|
2010
|
4.197.890
|
4.707.188
|
2.464.722
|
11.369.800
|
2011
|
4.836.547
|
5.120.621
|
2 429 169
|
9.957.168
|
2012
|
5.679.484
|
5.776.028
|
2.459.400
|
13.914.912
|
2013
|
5.954.333
|
6.112.437
|
2.348.487
|
14.415.257
|
2014
|
6.178.757
|
6.060.937
|
1.983.415
|
14.223.109
|
2015
|
6.385.343
|
5.733.803
|
1.874.925
|
13.994.071
|
2016
|
6.588.527
|
5.758.336
|
1.733.292
|
14.080.155
|
2017
|
7.804.588
|
6.536.073
|
1.602.925
|
15.943.586
|
|
TURKSTAT
According to (TAPKI, KAYA, TAPKI, DAĞISTAN, ÇİMRİN, & SELVİ, 2018) In Turkey, Cattle Culture, Cattle-culture hybrid, Cattle-Indigenous are found in the presence of cattle which constitute 98.99% of the cattle. According to the data of 2017 in total cattle, the rate of cattle breeding was 48.95% while the ratio of the crossbreed cattle was determined as 40,99% and the rate of domestic breed cattle was 10,06%. When the years are examined, the rate of culture breed cattle is increasing gradually between 2002 and 2017, and the proportion of domestic race cattle is gradually decreasing. While the proportional shares of the hybrid breed cattle are declining between the years 2002-2017, the decrease in domestic breed cattle is faster (Table 3). Indigenous breeds of cattle are abandoned by culture breed the increase in cattle milk and meat yield of these races to be very low compared to culture races, more animals are grown in the pasture is due to the low size of small and carcass weights and the fact that animal husbandry is mostly done in closed system barns. (TAPKI, KAYA, TAPKI, DAĞISTAN, ÇİMRİN, & SELVİ, 2018) The difference increasing and decreasing between 1991 and 2017 in Cattle Culture, Cattle-culture hybrid, Cattle-Indigenous are shown in the following graph (3.0).
Graph 3.0 show comparisons of cattle between in 1991 and 2017
TURKSTAT
Livestock milk production in Turkey
The amount of milk production was around 768.6 million tons in the world by 2013, and 635.6 million tons of that was cows’ milk. Turkey is among the 10 largest milk producers in the world. Dairy products have an important role in the Turkish diet. Consumption level of liquid milk is very low; the most common form of milk consumption is yogurt, followed by white cheese (feta type) and Ayran, a liquid salted milk drink. When analyzed according to the number of animals milked a year in Turkey is the total number of animals per milking 20.699.894, while the number of milking cattle is 18.831.720 million tonnes. Although the rate of cattle in the animals is low, 90.64% of the milk production is obtained from bovine animals. Total raw milk production in 2017 amounted 20.7 million tons and 18.8 million ton of them comes from cattle are shown in Table (4.0). Turkey ranks in 10th place among the world milk producers. Approximately 91-92 % of the total raw milk production is cow’s milk production (ÇEVİK, 2018).
When examined between 2002-2017 years milk production in Turkey seems to rise to 20,699,894 tons of total milk production of 8,408,568 tons. Total milk production is composed of cattle and sheep. However, more than 90% of milk production is obtained from bovine animals. This share has not changed much since the years examined. Cattle that are milked consist of cattle and latches. The milk yields obtained from animals were examined by years. Milk productivity increased by 84.6% between 2002 and 2017 (ÇEVİK, 2018). While the lactation milk yield per animal was 1.705 kg in 2002, it reached 3.148 kg in 2017. This is due to the high milk yield, improvements in nutrition and housing conditions. When milk yield per animal was examined, it was observed that milk yields varied between 980 kg and 1000 kg per year (Table 4.0).
|
|
|
|
Table 4.0 shows milk production from 2002 to 2017
|
years
|
Total milk production (tonnes)
|
Cattle milk production (tonnes)
|
Rate (%)
|
2002
|
8.408.568
|
7.541.555
|
89,69
|
2003
|
10.611.011
|
9.562.916
|
90,12
|
2004
|
10.679.407
|
9.648.605
|
90,35
|
2005
|
11.107.897
|
10.064.260
|
90,60
|
2006
|
11.952.100
|
10.903.660
|
91,22
|
2007
|
12.329.789
|
11.309.715
|
91,73
|
2008
|
12.243.040
|
11.286.598
|
92,19
|
2009
|
12.542.186
|
11.615.756
|
92,61
|
2010
|
13.543.674
|
12.454.031
|
91,95
|
2011
|
15.056.211
|
13.842.800
|
91,94
|
2012
|
17.401.262
|
16.024.827
|
92,09
|
2013
|
18.223.712
|
16.706.956
|
91,68
|
2014
|
18.630.859
|
17.053.653
|
91,53
|
2015
|
18.654.682
|
16.996.271
|
91,11
|
2016
|
18.489.161
|
16.849.348
|
91,13
|
2017
|
20.699.894
|
18.831.720
|
90,97
|
Graph 4.0 shows total milk production
Livestock meat production in Turkey
Red meat production, which was 329.25 thousand tons in 2002, increased by more than 1 million tonnes with an increase of 49.29% in 2017 compared to 2002. (Table 5.0). The number of slaughtered cattle increased by 103.03% in 2017 compared to 2002, according to the index values fluctuating between the years 2002-2017. The number of slaughtered buffaloes decreased to 60.56% in 2017 as a result of 2002. The total number of slaughtered cattle increased by 107%. (ÇEVİK, 2018)The number of buffaloes cut increased by 55.49% in 2010 and remained behind 2002 in other years (Table 5.0).
Utilized in various ways, by cutting the number of cattle in Turkey is given in Table 5.0. The number of slaughtered cattle increased by 103.03% in 2017 compared to 2002, according to the index values fluctuating between the years 2002-2017. The number of slaughtered buffaloes decreased to 60.56% in 2017 as a result of 2002. The total number of slaughtered cattle increased by 107%. The number of buffaloes cut increased by 55.49% in 2010 and remained behind 2002 in other years (Table 8). The share of cattle in red meat production is given in Table 9. The share of cattle in total red meat production was 87.79% in 2017. This rate fluctuates a little though by years. The remaining 12.21% share belongs to small ruminant animals and the meat production from bovine animals is about 7 times higher than the meat products obtained from bovine animals. Proportionally 99, 86’s% of red meat derived from beef cattle in Turkey belongs. (Ertaş & Orhan, 2018) This ratio has not changed significantly since 2002-2017. In 2017, meat production was low compared to 2016 and 2017, mainly due to red meat imports. In our country, buffalo meat production has a very low share in total meat production (ÇEVİK, 2018).
Table 5.0; the amount of red meat production of the large animals in Turkey (ton)
Years
|
Beef meet
|
Rate (%)
|
Buffalo meat
|
Rate (%)
|
Total red meat production
|
Rate(%)
|
2002
|
327.629
|
99,51
|
1630
|
0,49
|
329.259
|
100,00
|
2003
|
290.454
|
99,42
|
1709
|
0,58
|
292.163
|
100,00
|
2004
|
365
|
99,47
|
1950
|
0,53
|
366.95
|
100,00
|
2005
|
321.681
|
99,51
|
1577
|
0,49
|
323.258
|
100,00
|
2006
|
340.705
|
99,48
|
1774
|
0,52
|
342.479
|
100,00
|
2007
|
432.406
|
99,54
|
1989
|
0,46
|
434.395
|
100,00
|
2008
|
370.619
|
99,64
|
1334
|
0,36
|
371.953
|
100,00
|
2009
|
325.286
|
99,69
|
1005
|
0,31
|
326.291
|
100,00
|
2010
|
618.584
|
99,46
|
3387
|
0,54
|
621.971
|
100,00
|
2011
|
644.906
|
99,75
|
1615
|
0,25
|
646.521
|
100,00
|
2012
|
799.344
|
99,78
|
1736
|
0,22
|
801.08
|
100,00
|
2013
|
869.292
|
99,95
|
366
|
0,04
|
869.658
|
100,00
|
2014
|
881.999
|
99,94
|
526
|
0,06
|
882.525
|
100,00
|
2015
|
1.014.926
|
99,97
|
326
|
0,03
|
1.015.252
|
100,00
|
2016
|
1.059.195
|
99,97
|
351
|
0,03
|
1.059.546
|
100,00
|
2017
|
987.482
|
99,86
|
1.339
|
0,14
|
988.821
|
100,00
|
Source; Anonim, 2017b
Cattle price in Turkey
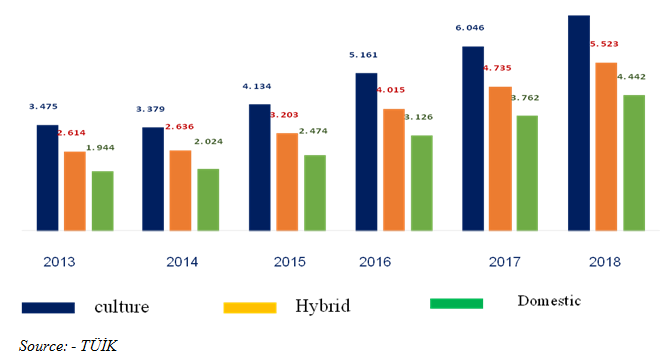
Animal product efficiency is an important factor in the price formation of bovine animals. The price of an average culture animal is much higher than that of hybrid and domestic animals (28% and 59%, respectively) are shown in the graph (5.0). In Turkey, animal prices are on an upward trend. In the 2013-2017 periods, the average annual price increase was 15% in culture animals and 16% in hybrid animals. In the same period, the increase in domestic animal prices displayed a more stable outlook and was realized like 18%. It is thought that this situation is caused by the sacrifice of animal market dynamics that do not hear the pressure of import and that the demand progresses regularly (ÇEVİK, 2018).
Graph 5.0 shows cattle prices in Turkey from 2013 -2017 periods
This year, the producers do not earn a profit from the sales of the defending the Bronze, "Prices of bovines are nearly the same as last year's prices. Producer this year, crushed under input costs." found in the evaluation. There is a problem with the presence of sacrificial animals. Describing the animals should be preferred when the hair is smooth, eyes bright and over two years of age, said that all the limbs of the sacrificial animals should be in place. Information about sacrificial prices, "Bovine animal prices starting from 7 thousand pounds, 15 thousand pounds are reached. Every year in Turkey 3.5 million animals (approximately 950,000 head of cattle, 2.5 million of sheep) are slaughtered for the sacrifice holiday. If total animal numbers are taken into consideration, this amount to about eight percent of the total population is sent to sacrifice holiday per year. While the price of live weight cattle was 28 TL ($8) per kg last year, the current price has increased 35 TL ($10) in 2017 due to the continued high feed prices and other increasing costs (Oktay, 2018).
Consumption
According to TURKSTAT data, in 2016, the average price of beef meat increased by 7% compared to the previous year and was realized as 38.42 TL. In 2017, it increased by 8% compared to the previous year. In 2017, the price of veal consumers increased by 8% compared to the previous year and rose by 41.63 TL / kg. While Dana carcass prices were 18, 07 TL / kg in 2014, 26, 21 TL / kg and Lamb Carcass Prices increased by 38% to 27, 28 TL / kg in 2017 with a 45% increase (Oktay, 2018).
Table 6: Turkey Meat and Meat Products Consumer Prices (TL / kg)
Products
|
2008
|
2009
|
2010
|
2011
|
2012
|
2013
|
2014
|
2015
|
2016
|
2017
|
Dana Eti
|
15,32
|
17,36
|
24,14
|
23,27
|
23,80
|
24,66
|
28,43
|
35,82
|
38,42
|
41,63
|
Sucuk
|
24,87
|
26,50
|
32,93
|
33,45
|
34,80
|
37,76
|
43,84
|
51,05
|
53,68
|
57,66
|
Salam
|
20,21
|
21,46
|
25,35
|
27,59
|
27,59
|
29,21
|
33,64
|
40,16
|
38,52
|
37,19
|
Sosis
|
19,63
|
20,17
|
22,45
|
25,73
|
27,83
|
29,25
|
32,88
|
33,10
|
34,55
|
37,96
|
Source: TÜİK
There is a reference base price application in the dairy market where informality is high. The relevant application is the determining factor in the course of consumer prices. During the period of July 2014-December 2016, the fixed reference price of milk at the level of 1.15 TL / liter has been gradually increased in the following periods and it has been determined as 1.70 TL / liter from August 2018 (Zübeyir, Dilek, & Kezban, 2017).
In parallel with the reference price, milk prices, which remained relatively flat until 2017, turned their upward trend in the recent period due to increased feed costs. As of August 2018, domestic milk prices increased by 20.9%. The milk/feed parity show how large milk producers can buy milk for 1 kg of milk. According to the data published by the Meat and Milk Institute (ESK), the profit margin of the milk producers displayed a positive outlook in the first quarter of 2018 but decreased significantly in recent months due to higher feed prices (Mehmet, 2016).
Cattle Import and Export in Turkey
Turkey in 2017 import 113.566 head of cattle with 254.793.487 million dollars, at 2.244$ per cattle. And imports of live animals closely by investors in evaluating the current growers to enter the market are shown in Table 7.0. Sector officials state that the animals supplied from abroad are about 300 kg and the cost is around 4 dollars/kg. While it takes 6 months for the animals to reach the feeder, the breeders usually make the payment via the spot exchange in the delivery. The daily feed requirement of bovine animals is 2% of the total body weight. Animals brought from abroad are sent to slaughter between 6-8 months (Zübeyir, Dilek, & Kezban, 2017). In this process, industry officials stated that the animal weight of the animals reached 550 kilos and 300 kg of carcass meat production per animal was targeted. The price of cattle that can be imported into 4.380 TL in 2017 is increasing due to the depreciation of TL. Moreover, the increasing volatility in exchange rates increases the exchange rate risk that producers are exposed to due to payments made at the spot exchange rate at the date of delivery of imported animals, and it makes the predictability of costs difficult. Turkey imports within the framework of the declining profit margins in the industry based on agriculture and livestock policies followed and therefore manufacturers are increasing capital needs. Considering that the inputs are priced at the exchange rate and the sales are made with TL, concerns regarding the sustainability of the production model applied in the current conjuncture are raised. On the other hand, it is observed that most of the producers do not take measures against currency risk (Zübeyir, Dilek, & Kezban, 2017).
Table 7.0 Turkey's Cattle Imports and Exports
Years
|
Export Quantity (head)
|
Import Quantity (head)
|
Exports (USD)
|
Imports (USD)
|
Imports (USD / Head)
|
2000
|
0
|
2.695
|
0
|
3.238.192
|
1.202
|
2001
|
0
|
290
|
0
|
829.52
|
2.86
|
2003
|
0
|
2.127
|
0
|
3.272.729
|
1.539
|
2004
|
1
|
0
|
184
|
0
|
0
|
2005
|
0
|
1.579
|
0
|
3.135.607
|
1.986
|
2006
|
0
|
483
|
0
|
1.165.806
|
2.414
|
2007
|
0
|
3.854
|
0
|
6.625.418
|
1.719
|
2008
|
0
|
5.393
|
0
|
16.417.761
|
3.044
|
2009
|
0
|
4.01
|
0
|
13.306.818
|
3.318
|
2010
|
0
|
19.928
|
0
|
65.544.857
|
3.289
|
2011
|
0
|
78.565
|
0
|
292.952.534
|
3.729
|
2012
|
0
|
48.702
|
0
|
163.824.429
|
3.364
|
2013
|
319
|
31.873
|
1.120.080
|
102.182.831
|
3.206
|
2014
|
540
|
23.676
|
1.948.050
|
71.878.355
|
3.036
|
2015
|
9
|
48.595
|
51.32
|
133.329.302
|
2.744
|
2016
|
0
|
64.126
|
0
|
169.120.707
|
2.637
|
2017
|
0
|
113.6
|
0
|
254.793.487
|
2.244
|
|
Source: TURKSTAT
Livestock support in Turkey
The livestock sector having considerably high added-value has been tried to be supported via various policies from 1923 to the present time. When compared to vegetative production industry in the past, desired goals for livestock could not be achieved because livestock supports are not continuous, do not have adequate infrastructure for applying supply policies and accordingly, problems of livestock could not be eliminated (Ertürk & Orhan, Livestock Support Policies In Turkey Since 2000, 2015). Livestock was not imported because the Ministry of Agriculture and Rural Affairs did not issue the control certificate for livestock and meat import since 26.8.1996 on the account of the fact that “foot and mouth disease existed in Turkey and health of imported animals could not be protected because of the illness in Turkey. Tools of agricultural support to be used until 2010 are Direct Income Support (DIS), Deficiency Payments, Compensatory Payments (Farmer Transition), Livestock Support (fodder crops, artificial insemination, breeder incentive, milk premium, risk-free livestock region, bee-keeping, fisheries) (Ertürk & Orhan, Livestock Support Policies In Turkey Since 2000, 2015).
Support payments of livestock
Table 8.0 illustrates that agricultural support between 2000 and 2017 reached 4 billion dollars from 1.48 billion dollars by increasing 4 times in 2000. On the other hand, livestock supports increased to 1.16 billion dollars from 19 million dollars by increasing 60 times. While the rate of increase in livestock supports compared to the previous year.
Table 8.0 Total agricultural support payments and livestock supports * (Anonymous, 2017)
Years
|
Total agricultural Supports (Million TL)
|
Livestock support (million TL)
|
Increase rate of agricultural supports compared to the previous year (%)
|
Increase rate of livestock supports compared to the previous year (%)
|
2001
|
1.032
|
49
|
0.1
|
0.76
|
2002
|
2.276
|
75
|
0.55
|
0.35
|
2003
|
3.105
|
126
|
0.27
|
0.4
|
2004
|
3.084
|
209
|
-0.01
|
0.4
|
2005
|
3.708
|
345
|
0.17
|
0.39
|
2006
|
4.793
|
661
|
0.23
|
0.48
|
2007
|
5.643
|
741
|
0.15
|
0.11
|
2008
|
5.864
|
1.095
|
0.04
|
0.32
|
2009
|
4.749
|
908
|
-0.23
|
-0.21
|
2010
|
5.947
|
1.158
|
0.2
|
0.22
|
2011
|
7.085
|
1.728
|
0.16
|
0.33
|
2012
|
7.673
|
2.216
|
0.08
|
0.22
|
2013
|
8.774
|
2.756
|
0.13
|
0.2
|
2014
|
9.599
|
2.887
|
0.09
|
0.05
|
2015
|
10.141
|
2.953
|
0.05
|
0.02
|
2016
|
11.6
|
3.001
|
1.459
|
0.04
|
2017
|
12.8
|
3.793
|
1.2
|
0.79
|
* Complied by authors. ** With current prices
Figure 7.0 illustrates payments of agricultural and livestock supports. It was observed that supports were in an increasing trend despite decreases in 2009 and 2017.
Graph 7.0; shows the difference between Agricultural support and livestock support in recent years
|

Figure 7.0 – Total agricultural supports and livestock supports (Anonymous, 2017)
Annual increase rates for total agricultural supports and livestock supports from these supports were compared in Figure 3. The annual increase rate for livestock supports increased at a higher level compared to total agricultural supports. But, it can be asserted that I have followed a parallel trend since 2009 when a negative increase was observed compared to the previous year. Although the share of livestock supports increased to 30% after 2010, the rate of increase has shown a gradually decreasing structure as from 2011. Graph 10; shows an increasing rate of Agricultural support and livestock support in recent years (Sinem, 2017).
Figure 8.0– increase rate of agricultural and livestock supports compared to the previous year
Result
The livestock sector has an important place in Turkey and as with the whole world in terms of the sufficient and balanced nutrition of the growing population and its use as a raw material for many fields. However, unlike other sectors, the livestock sector contributes to the economy of the country because it has many sectors and it also provides a solution to the social problems of the country. Through livestock production from 2000 up to the present day; measures for environmental protection have been put into practice along with supports regarding meat quality, marketing support, modernization of livestock enterprise.
Current findings revealed that the share of agriculture in the total budget was quite low compared to other sectors and such a share did not change much despite the continuous changes in agricultural and support policies. Considering the distribution of the supports based on types, it was observed that the increase in livestock supports and subsidiary payments made especially to supply-deficit products were considered as positive outcomes of implemented support policies.
q Although there is significant potential in terms of the number of animals, yields obtained from those animals are low.
q According to 2000-2017 data from the Turkish Statistical Institute, the number of livestock and production of animal products responded to support policies and thus increased and policies were successful even though they were not sufficient enough to meet the demand of the increasing population.
q The fact that changes in production are supersensitive to changes in supports indicates structural problems of livestock establishments have continued.
Conclusion
In the livestock sector such as cattle production is low In order to improve it is important to develop management and maintain support policies for the livestock sector. The livestock sector in turkey needs to turn to the construction and improvement of permanent end sustainable-sized enterprises.
Reference
A. C., & B. I. (2019). Turkey's livestock sector: Production, consumption and policies. Livestock Research for Rural Development.
ÇEVİK, B. (2018). BÜYÜKBAŞ HAYVANCILIK SEKTÖRÜ. Türkiye İş Bankası.
Ertaş, N., & O. D. (2018). 1991 Sonrasında Van’da Küçükbaş Hayvancılığın Gelişim Seyri ve Sorunları. TÜCAUM 30. Yıl Uluslararası Coğrafya Sempozyumu.
Ertürk, Y. E., & O. Y. (2015). Livestock Support Policies In Turkey Since 2000. 6th International Scientific Agricultural Symposium "Agrosym 2015", 15-18 October 2015. The University of East Sarajevo, Faculty of Agriculture, Jahorina, Bosnia and Herzegovina.
Ertürk, Y. E., & O. Y. (2015). Livestock Support Policies In Turkey Since 2000. International Scientific Agricultural Symposium.
M. H. (2016). Agricultural Support Policies and Public Budgeting in Turkey. Ministry of Food, Agriculture, and Livestock, Ankara, Turkey.
NEWS, D. (2018, February 07 ). animal, livestock, meat, food, Ahmet Eşref Fakıbaba, Fakıbaba .
O. G. (2018). TÜRKİYE BÜYÜKBAŞ HAYVANCILIK SEKTÖRÜNÜN AB ÜLKELERİ İLE KARŞILAŞTIRMALI ANALİZİ. ResearchGate .
S. D. (2017). Turkey Livestock and Products Annual Report 2017. Ankara: GAIN Report Number.
TAPKI, N., KAYA, A., TAPKI, İ., DAĞISTAN, E., ÇİMRİN, T., & SELVİ, M. H. (2018). Türkiye’de Büyükbaş Hayvancılığın Durumu ve Yıllara Göre Değişimi. Journal of Agricultural Faculty of Mustafa Kemal University , 324-339.
Z. T., D. Ş., & K. Ö. (2017). TÜRKİYE’DE HAYVANCILIK SEKTÖRÜNDEN SÜT İNEKÇİLİĞİNİN ÖNEMİ VEYURT İÇİHASILAYAKATKISI VE DEDIŞÜLKELERLEKARŞILAŞTIRILMASI. Ömer Halisdemir Üniversitesi İktisadi ve İdari Bilimler Fakültesi Dergisi , 60-74.
Authour: Abdirizak Ali Abdullahi
Contact: 00905531710490 / 00252615587465/ 00252615825475/ 00252615206230
Email: crisaaqali@gmail.com
Adress: Değirmenaltı Mahallesi, Şht. Zülfükar Tezcan Sk. No: 2, 59030 Tekirdağ Merkez/Tekirdağ Turkey